1. Overview
The forecast system is based on the MASNUM (Laboratory of MArine Sciences and NUmerical Modeling, State Oceanic Administration, China) wave-tide-circulation coupled numerical model. The circulation part is based on POM (Princeton Ocean Model), the wave part is MASNUM-WAM model, the meteorological forcings are from NCEP products. The wave-induced viscosity Bv is added to the viscosity and diffusivity calculated from the M-Y scheme in POM. A nested scheme from the quasi-global to Southeast Asian area is used to obtain the open boundary conditions (Fig. 1). The detailed configurations of the models are described in Table 1.
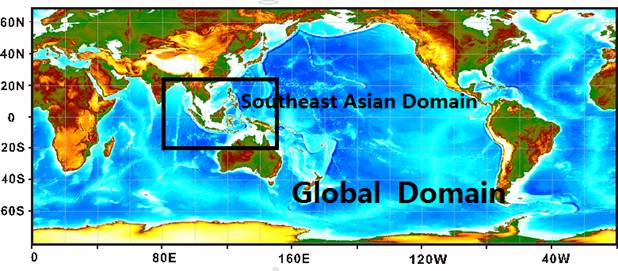
Figure 1 the panel of nested scheme for the quasi-global to Southeast Asian water
Table 1 Operational Model Configurations of the Forecast System
|
|
Global model
|
Southeast Asian water
|
|
Domain
|
0º E~360º E,
78º S~65º N
|
80º E~150º E,
20º S~25º N
|
|
Resolution
|
(1/2)º × (1/2)º
~55Km
|
(1/6)º × (1/6)º
~20Km
|
|
Grids
|
Horizon:721 × 287
Vertical 21 layer
|
Horizon:421× 271
Vertical 51 layer
|
|
Results
|
2008 Apr.~ present
|
2014 Jan.~ present
|
2. MASNUM-WAM model
MASNUM-WAM model (formerly called LAGFD-WAM) was proposed early in 1990s in Laboratory of Geophysical Fluid Dynamics (LAGFD), First Institute of Oceanography (FIO) of SOA, China. It is a third-generation wave model and it has marked originality in the following areas:
1) The energy and action energy spectrum balance equations,
2) The source functions of dissipation and bottom friction,
3) The wave-current interaction source function,
4) The computational scheme.
In the model, the wave energy spectrum balance equation and its complicated characteristic equations are derived in wave-number space. The breaking dissipation source function is adopted a theoretical result based on statistical study of breaking waves (Yuan et al. 1986). The characteristic inlaid method is applied to integrate the wave energy spectrum balance equation.
The model has been compared with WAM model in typical wind fields and gave concerted results in general sea state and good improvement in high sea state. Also the model has been used in China seas for forecast and hindcast practices and got results consistent with filed measured data. In order to evaluate the wave-induced mixing in the upper ocean and the impact of surface waves on ocean-atmosphere fluxes, a global wave numerical model in spherical coordinates was developed based on the previous LAGFD-WAM regional model. Since the LAGFD became MASNUM (Key Lab of Marine Science and Numerical Modeling, SOA, China), this model is also referred as MASNUM wave model.
In order to meeting the high resolution��large-scale wave simulation and the study of couple model, A parallel MASNUM-WAM model was developed using MPI (Message Passing Interface). The computation capacity among computer nodes is balanced by logical partition and mapping of data. By coarse granularity computation, the traffic becomes less, and so the implementation efficiency is increased.
3. POM model
POM (Princeton Ocean Model) is created by Alan Blumberg and Mellor around 1977. It is a 3-D primitive equation ocean model. The model was developed and applied to oceanographic problems in the Atmospheric and Oceanic Sciences Program of Princeton University, the Geophysical Fluid Dynamics Laboratory of NOAA. The model is oftentimes referenced as the Princeton Ocean Model (POM). The principal attributes of the model are as follows:
• It contains an imbedded second moment turbulence closure sub-model to provide vertical mixing coefficients.
• It is a sigma coordinate model in that the vertical coordinate is scaled on the water column depth.
• The horizontal grid uses curvilinear orthogonal coordinates and an "Arakawa C" differencing scheme.
• The horizontal time differencing is explicit whereas the vertical differencing is implicit. The latter eliminates time constraints for the vertical coordinate and permits the use of fine vertical resolution in the surface and bottom boundary layers.
• The model has a free surface and a split time step. The external mode portion of the model is two-dimensional and uses a short time step based on the CFL condition and the external wave speed. The internal mode is three-dimensional and uses a long time step based on the CFL condition and the internal wave speed.
• Complete thermodynamics have been implemented.
The turbulence closure sub-model is one that was introduced (Mellor 1973) and then was significantly advanced in collaboration with Tetsuji Yamada (Mellor and Yamada 1974; Mellor and Yamada 1982). It is often cited in the literature as the Mellor-Yamada turbulence closure model (but, it should be noted that the model is based on turbulence hypotheses by Rotta and Kolmogorov which we extended to stratified flow cases). Here, the Level 2.5 model is used together with a prognostic equation for the turbulence macro-scale. The closure model is contained in subroutines PROFQ and ADVQ. A list of papers pertaining to the closure model is also included in the Reference section. A much more extensive list of references by user of POM is on the web site.
By and large, the turbulence model seems to do a fair job simulating mixed layer dynamics although there have been indications that calculated mixed layer depths are a bit too shallow (Martin 1985). Also, wind forcing may be spatially smoothed and temporally smoothed. It is known that the latter process will reduce mixed layer thicknesses (Klein 1980). Further study is required to quantify these effects.
The sigma coordinate system is probably a necessary attribute in dealing with significant topographical variability such as that encountered in estuaries or over continental shelf breaks and slopes. Together with the turbulence sub-model, the model produces realistic bottom boundary layers which are important in coastal waters (Mellor 1985) and in tidally driven estuaries (Oey et al. 1985a , b) which the model can simulate since it does have a free surface. More recently, we find that bottom boundary layers are important for deep water formation processes (Zavatarelli and Mellor 1995; Jungclaus and Mellor 1996; Baringer and Price 1996) and, possibly, for the maintenance of the baroclinicity of oceans basins (Mellor and Wang 1996).
Based on the technique of Message Passing Interface (MPI), a parallelized version of POM model was set up. Two efficient parallelization schemes were designed and implemented for this parallelized POM. It was concluded that the parallelization of this wave-circulation coupled model is very efficient and portable to a variety of parallel architectures.
4. Coupling Method
An accurate representation of the upper ocean mixing processes and thus the oceanic surface mixed layer is important for ocean circulation models, whether they are aimed at small-scale coastal simulations or for large-scale global climate simulations. The vertical mixing in many three-dimensional numerical ocean models are often based on turbulence closure schemes, such as the widely used Mellor-Yamada (M-Y) model (Mellor and Yamada 1982). However, a common problem of such schemes is an underestimation of surface mixing and mixed-layer depth, and thus the sea surface temperatures (SST) is overestimated, ML is too shallow and the seasonal thermocline is underestimated, especially during the summer (Martin 1985; Kantha and Clayson 1994; Ezer 2000; Mellor 2001). The oceans contain nearly all of the thermal mass of the coupled ocean-atmosphere system and are regarded as the flywheel of climate fluctuations. ML is particularly important to the process of atmosphere-ocean interaction, e.g., in ENSO prediction model. How to parameterize the diapycnal mixing in the upper oceans is important to improve our understanding of the atmosphere-ocean system.
Base on the wave-circulation coupled theory developed by Professor Fangli Qiao and Yeli Yuan (Qiao et al 2004), the wave-induced vertical viscosity (or diffusivity) BV is defined, which can be used as a parameter to estimate the strength of wave-induced mixing.
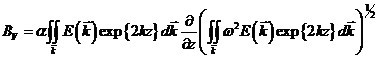
Where  is the wave number spectrum which can be calculated from a wave numerical model. It will change with (x, y, t) , so BV is the function of (x, y, z, t) . We calculated BV using MASNUM-WAM model and add it to the viscosity (or diffusivity) provide by the M-Y scheme in POM.