1. Validation of the forecasted SST
Forecasted SST are validated by using AVHRR OI SST in 2013 with horizontal resolution of 0.25dgree*0.25degree, time resolution is 1 day, which are obtained using Advanced Very High Resolution Radiometer (AVHRR) infrared satellite SST assimilated with vessel on board observation and bouys observation.
Figure 1 The evolution of the mean absolute error (MAE) between daily 24 h (black), 48 h (red) and 72 h (blue) forecasted SST and AVHRR OI SST in 2013. The annual mean MAEs in 2013 are 0.48ºC , 0.49ºC and 0.50ºC, respectively.
2. Validation of the forecasted temperature profiles
The forecasted vertical temperature profiles are validated by using the RAMA (Research Moored Array for African-Asian-Australian Monsoon Analysis and Prediction, Fig 2) buoy temperature data. The data are from 0 -500m with 15 layers. Table 1 gives the MAE statistics of the forecasted temperature vertical profiles.
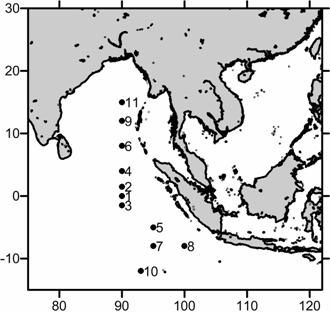
Figure 2 Positions of the RAMA buoys used in the model validation
Table 1 statistics of the forecast temperature vertical profiles MAE error (ºC)
at the RAMA buoys stations
buoy |
longitude |
latitude |
MAE error 24h |
MAE error 48h |
MAE error72h |
1 |
90E |
0N |
0.82 |
0.82 |
0.83 |
2 |
90E |
1.5N |
0.79 |
0.79 |
0.80 |
3 |
90E |
1.5S |
0.92 |
0.92 |
0.92 |
4 |
90E |
4N |
0.79 |
0.80 |
0.81 |
5 |
95E |
5S |
0.70 |
0.70 |
0.71 |
6 |
90E |
8N |
0.57 |
0.57 |
0.57 |
7 |
95E |
8S |
0.68 |
0.68 |
0.69 |
8 |
100E |
8S |
0.91 |
0.91 |
0.92 |
9 |
90E |
12N |
0.58 |
0.58 |
0.59 |
10 |
93E |
12S |
0.95 |
0.96 |
0.97 |
11 |
90E |
15N |
0.70 |
0.71 |
0.72 |
average |
|
|
0.76 |
0.77 |
0.78 |
3. Validation of the surface zonal current
The forecasted surface zonal currents are validated by using the RAMA (Research Moored Array for African-Asian-Australian Monsoon Analysis and Prediction) buoy data.
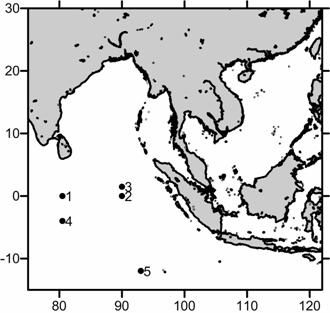
Figure 3 Positions of the RAMA buoys used in the zonal current validation
Figure 4 Variation of 24h forecast surface zonal current (black) and RAMA buoy data (green)
4. Validation of mixed layer depth in the upper ocean
The forecasted mixed layer depth is validated by using the RAMA (Research Moored Array for African-Asian-Australian Monsoon Analysis and Prediction) buoy data and ARGO profile data.
Figure 5 Comparison of 24h forecasted mixed layer depth (black) and RAMA buoy data (blue dot, up panel) at (90° E 15° N), and ARGO data in the Bay of Bengal ( 85-93° E , 10-18° N , down panel).